This UI has originated from the article How to pick the least wrong colors by Matthew Ström. The article describes a generator for category colors for charts and visualization that uses a simulated annealing algorithm with a cost function that is maximizing the differences and accessibility of the colors in the set. The article is very nice and has accompanying javascript code, but can be used only from command line.
Sometimes I need to quickly pick colors for charts or visualizations, and I thought having a UI for this would be very nice.
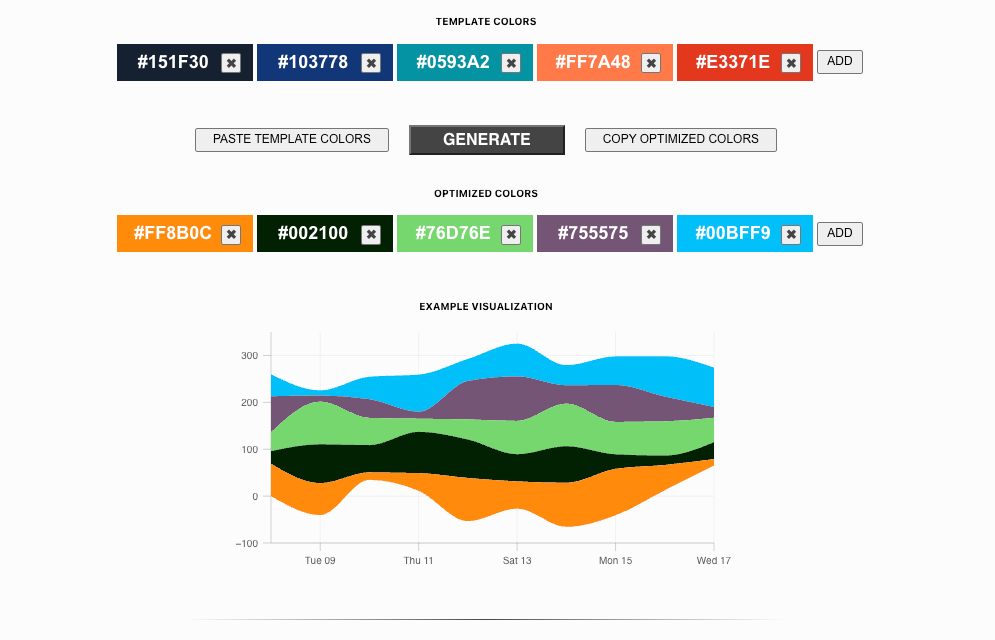
So I created this UI for the generator in React. I also ported and refactored the initial code to Typescript.
The generator is available online at: https://aleris.github.io/category-colors/.
Usage
The algorithm is not deterministic, so running it multiple times will generate different results.
The generator allows copying and pasting multiple colors to start from and run the algorithm to generate a new set.
You can also add more colors to the output, and the number of colors can be bigger than the number of template colors. I use this to generate a bigger set of colors and then pick the ones I like.
You can copy colors directly from somewhere, and paste them to start from.
For example, try to copy a row from below and then click on PASTE TEMPLATE COLORS,
or paste directly in one of the inputs from UI. It will parse the input and fill the template colors automatically
adapting to the number of colors in the input.
#3EC240 #65C590 #AC2444 #B9A263 #AB088D
#1D594E #F2CB05 #F29F05 #F28705 #F23030
#151F30 #103778 #0593A2 #FF7A48 #E3371E
You can also copy sets of template colors from Adobe Color.
The code for the UI is available on GitHub.